Understanding How Valgrind Monitors U-Boot Memory Allocations
About the Project
As part of my doctorate program, I’ve been analyzing how Valgrind keeps track of memory allocations in Das U-Boot (aka U-Boot). During my research, I discovered that out of the box, special configuration is required for Valgrind to “see” the allocations and frees executed by U-Boot. This blog post explores this nuance as I thought it was pretty interesting and worth a short blog post.
A Brief Overview of Valgrind Internals
Valgrind is the de-facto dynamic binary analysis tool for tracking memory management issues in Linux applications. Dynamic Binary Instrumentation (DBI) is a type of dynamic analysis where a target program (ex: U-Boot) is executed under the “supervision” of another program (ex: Valgrind) to ultimately perform some type of introspection or manipulation of the target binary’s execution. In the case of Valgrind, the typical introspection is to track allocations and frees of memory to provide a report of how many blocks of memory were still in use at the end of a program’s execution. This data informs the developer whether or not all of the memory was freed and thus whether or not a memory leak may exist.
The DBI approach allows the supervisory program deep insight into the execution of a target binary, but this occurs at the cost of speed.
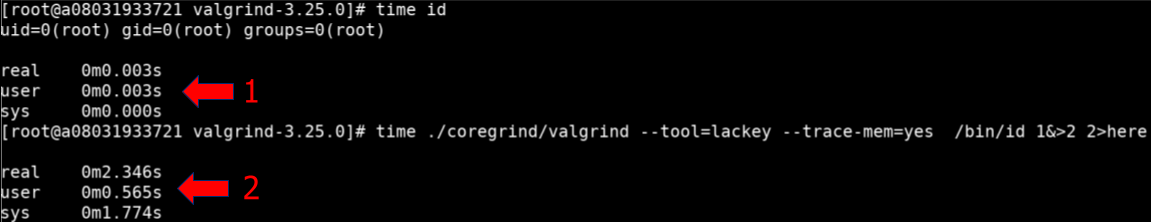
As a rudimentary example, let’s explore tracing the id command under Valgrind execution.
Highlighted by the red one below shows the time of execution to simply just run the id command.
The red two shows the same command, except it’s running under Valgrind with the tool “Lackey” performing introspection of execution.
The Lackey tool tracks reads and writes that a target application is performing during execution.
Most people think of Valgrind as just a tool to perform memory checks, but that is simply one “tool” Valgrind has.
Memcheck is the default value when no other CLI options are provided to the utility.
Valgrind has numerous tools that can help with debugging complex applications, including thread errors, heap profilers, cache profilers, etc…
While this example is simple, it shows the performance impact DBI tools like Valgrind have on execution. This also introduces another element of Valgrind; its plugin system which allows for the development of custom introspection utilities called tools. Valgrind tools are written in C, and can instrument areas in a target application you care about, this is done in an architecture-agnostic way by operating on Valgrind’s higher level Intermediate Representation (IR) language called VEX. This IR is then executed by Valgrind along with the appropriate tool (memcheck by default) defined by the end user. The Lackey tool is specifically called out in Valgrind’s documentation as a reference of how to instrument
instrument() is the interesting one. It allows you to instrument VEX IR, which is Valgrind’s RISC-like intermediate language. VEX IR is described fairly well in the comments of the header file VEX/pub/libvex_ir.h. The easiest way to instrument VEX IR is to insert calls to C functions when interesting things happen. See the tool “Lackey” (lackey/lk_main.c) for a simple example of this, or Cachegrind (cachegrind/cg_main.c) for a more complex example.
Valgrind Documentation, Writing Tools 2.2.6-Instrumentation
As an example of instrumenting “load” operations, Lackey has a switch statement that looks like this:
// ./lackey/lk_main.c
case Ist_LoadG: {
            IRLoadG* lg       = st->Ist.LoadG.details;
            IRType   type     = Ity_INVALID; /* loaded type */
            IRType   typeWide = Ity_INVALID; /* after implicit widening */
            typeOfIRLoadGOp(lg->cvt, &typeWide, &type);
            tl_assert(type != Ity_INVALID);
            if (clo_trace_mem) {
               addEvent_Dr_guarded( sbOut, lg->addr,
                                    sizeofIRType(type), lg->guard );
            }
            if (clo_detailed_counts) {
               instrument_detail( sbOut, OpLoad, type, lg->guard );
            }
            addStmtToIRSB( sbOut, st );
            break;
         }
Per the VEX IR documentation, Ist_LoadG is a “Guarded Load”.
Which really doesn’t tell us much other than intuitively, it’s supposed to “load something”; given that the Lackey tool tracks memory stores and loads, this makes sense. Better information is provided in the IRLoadG’s structure definition as shown below.
   struct {
      IREndness end;    /* Endianness of the load */
      IRLoadGOp cvt;    /* Conversion to apply to the loaded value */
      IRTemp    dst;    /* Destination (LHS) of assignment */
      IRExpr*   addr;   /* Address being loaded from */
      IRExpr*   alt;    /* Value if load is not done. */
      IRExpr*   guard;  /* Guarding value */
   }
   IRLoadG;
Valgrind is able to run executables out of the box, so there’s no need to add any additional debugging flags with gcc, although they could help in debugging memory related issues. The combination of Valgrind’s introspection tool Lackey, and the execution of the IR rather than a native binary add to computational overhead of Valgrind’s execution, thus making execution slower. The concept of operating on IR vs actual assembly is not unique to Valgrind. QEMU offers something similar via a plugin system to operate on Tiny Code Generation (TCG), their IR-esque language that bridges target binary to target-guest architecture.
Valgrind & U-Boot
When building U-Boot, you’re typically cross-compiling for the target embedded system. Several default development board configurations exist making it easy to ensure things like the load address are appropriately configured for a target embedded device. U-Boot also has a “sandbox mode” which allows you to build an ELF that you can run as a normal Linux application. In practice, sandbox mode is used to develop device agnostic items such as file system drivers. This ensures not everyone needs the same development device in order to be productive.
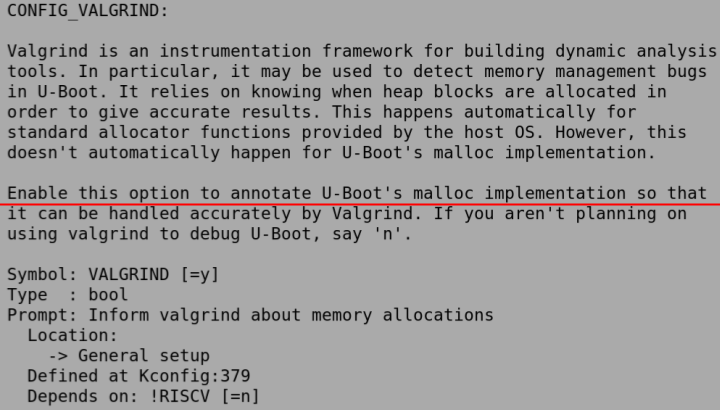
While reading the documentation, I found that for U-Boot to work with Valgrind, you must enable CONFIG_VALGRIND prior to building U-Boot. I initially found this odd, as Valgrind is supposed to work with binaries without any special configuration. However, U-Boot’s documentation sheds some light on this issue via the following notes:
The sandbox allocates a memory pool via mmap(). U-Boot’s internal malloc() and free() work on this memory pool. Custom allocators and deallocators are invisible to valgrind by default. To expose U-Boot’s malloc() and free() to valgrind, enable CONFIG_VALGRIND. Enabling this option will inject placeholder assembler code which valgrind interprets. This is used to annotate sections of memory as safe or unsafe, and to inform valgrind about malloc()s and free()s. There are currently no standard placeholder assembly sequences for RISC-V, so this option cannot be enabled on that architecture
The line in bold above piqued my curiosity in how this was actually implemented in U-Boot code.
The default Valgrind tool “Memcheck” specifically tracks mallocs and frees, thus memory allocation via mmap does not translate to something Valgrind can track.
Looking at the KBuild CONFIG_VALGRIND setting, the following can be found.
Digging into the code where checks for CONFIG_VALGRIND exist, two locations are found.
One in include/malloc.h with a simple #define free free_simple declaration and the other being the free_simple function below.
// common/malloc_simple.c
#if IS_ENABLED(CONFIG_VALGRIND)
void free_simple(void *ptr)
{
        VALGRIND_FREELIKE_BLOCK(ptr, 0);
}
#endif
This takes us to “the meat” of how this all works which is the #define macro of VALGRIND_FREELIKE_BLOCK.
#define VALGRIND_FREELIKE_BLOCK(addr, rzB)                              \
    VALGRIND_DO_CLIENT_REQUEST_STMT(VG_USERREQ__FREELIKE_BLOCK,         \
                                    addr, rzB, 0, 0, 0)
Valgrind has a trapdoor mechanism via which the client program can pass all manner of requests and queries to Valgrind and the current tool. Internally, this is used extensively to make various things work, although that’s not visible from the outside. For your convenience, a subset of these so-called client requests is provided to allow you to tell Valgrind facts about the behaviour of your program, and also to make queries. In particular, your program can tell Valgrind about things that it otherwise would not know, leading to better results.
U-Boot leverages this “FREELIKE block” to communicate to Valgrind that the previously allocated memory has been freed. But why is all of this necessary? U-Boot leverages custom memory allocation mechanisms that may not result in a free and thus have Valgrind report a false positive. This “trapdoor” mechanism allows the client program to specifically inform Valgrind of specific states that it would otherwise be unaware of.
The real magic comes in how it achieves this. The documentation states:
The macros in these header files have the magical property that they generate code in-line which Valgrind can spot. However, the code does nothing when not run on Valgrind, so you are not forced to run your program under Valgrind just because you use the macros in this file. Also, you are not required to link your program with any extra supporting libraries.
//file: valgrind.h

     /* The following defines the magic code sequences which the JITter
        spots and handles magically.  Don't look too closely at them as
        they will rot your brain.

        The assembly code sequences for all architectures is in this one
        file.  This is because this file must be stand-alone, and we don't
        want to have multiple files.

        For VALGRIND_DO_CLIENT_REQUEST, we must ensure that the default
        value gets put in the return slot, so that everything works when
        this is executed not under Valgrind.  Args are passed in a memory
        block, and so there's no intrinsic limit to the number that could
        be passed, but it's currently five.

        The macro args are:
           _zzq_rlval    result lvalue
           _zzq_default  default value (result returned when running on real CPU)
           _zzq_request  request code
           _zzq_arg1..5  request params

...truncated...
/*tracks malloc() et al, by using vg_replace_malloc.c. */
VG_USERREQ__MALLOCLIKE_BLOCK = 0x1301,
VG_USERREQ__RESIZEINPLACE_BLOCK = 0x130b,
VG_USERREQ__FREELIKE_BLOCK   = 0x1302,
/* Memory pool support. */
VG_USERREQ__CREATE_MEMPOOL   = 0x1303,
VG_USERREQ__DESTROY_MEMPOOL  = 0x1304,
VG_USERREQ__MEMPOOL_ALLOC    = 0x1305,
VG_USERREQ__MEMPOOL_FREE     = 0x1306,
...truncated...
The key take away here is these values effectively translate as no-ops that Valgrind will interpret as specific values with minimal performance impact.
Conclusion
Valgrind provides a unique communication protocol that client programs can leverage to inform Valgrind about the state of a program in situations that otherwise would provide false positives. Unfortunately, most of the internals are documented in the form of header files or example code so I suspect adoption is light. U-Boot’s use of custom allocators requires this functionality in order to avoid Valgrind false positives. Walking through all of this was a fun debugging exercise resulting in a deeper appreciation for how easy Valgrind is to use out of the box and how powerful of a framework it provides.