Houseplant CTF 2020 - Imagery
Houseplant CTF 2020 - Imagery
CTF challenge “Imagery” was a high-value forensics puzzle with the following description:
Photography is good fun. I took a photo of my 10 Windows earlier on but it turned out too big for my photo viewer. Apparently 2GB is too big. :(

https://drive.google.com/file/d/1y4sfIaUrAOK0wXiDZXiOI-q2SYs6M--g/view?usp=sharing Alternate: https://mega.nz/file/R00hgCIa#e0gMZjsGI0cqw88GzbEzKhcijWGTEPQsst4QMfRlNqg

Dev: Tom
Upon downloading the image, I originally ran basic forensic triaging tools on the large blob in an attempt to identify what it was.
The file command outputted “data”. After running strings libWTF identified some known Windows file paths.

This lead us down a rabbit holeof file carving. After running through the typical triage of file carving tools (foremost/scalpel/radare2) a team member commented that it might be a memory dump. This is where Volatitlity comes in.
Introducing Volatility
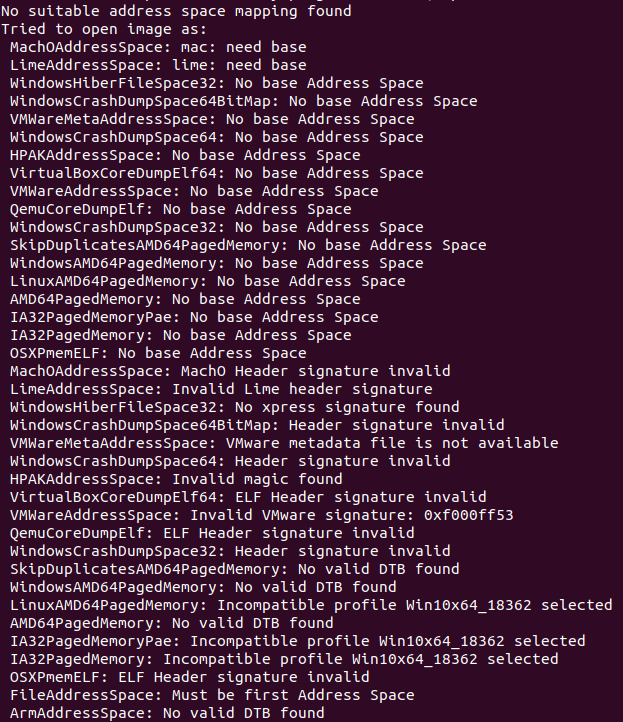
Volatility is a memory forensics framework that allows the end-user to quickly triage a memory dump of an operating system. One crucial component of using Volatility is knowing which memory profile to use. Memory profiles result in parsing data at different offsets. Leveraging the wrong memory profile will just result in an error like the one shown below.

After looping through all available profiles in a default volatility install, it was clear something was missing. Upon searching for additional Windows 10 memory profiles, LibWTF identified this FireEye GitHub repo.
After cloning this repo, and running a simple test of pslist to ensure the memory profile was correct, libWTF had success at listing running processes during the time the memory dump occurred.

Looking at the list of running processes, notepad.exe makes the most sense at face value to hold a flag for a CTF. Additionally, the organizers stated that the flag was in plain text. Now that a target process has been identified, we can dump the memory.

Dumping Memory
Volatility can dump the memory (and more) of a specific process for further analysis. By executing the command below, an end-user can begin to look at what was in notepad.exe’s memory during the time of capture.
mkdir notepad_memdump;
vol.py -f imagery.img --profile=Windows10_ memdump -p 6076 -D notepad_memdump/
Note, failing to specify a process with -p will dump all processes within the memory image.
At this point, a raw memory has been placed within the notepad_memdump/ directory.
LibWTF then ran a hexdump and redirected the output to a file.
xxd 6076.dmp > notepad.xxd
Finally, a recursive grep to identify the flag format was executed and the flag was revealed grep -rail "r.t.c.p".

Note, the “.” between rtcp is required per the hex-dump output.
Thanks for reading!